Best Practice Guide to Scaling PyTorch DistributedDataParallel (DDP) Training to Multiple Nodes on the Vega Supercomputer
Author: Darin Lah (IZUM)
1. Introduction
High-performance computing (HPC) systems enable deep learning workloads to scale beyond a single GPU or node. PyTorch DistributedDataParallel (DDP) is the recommended approach for distributed training because it provides efficient gradient synchronization, high GPU utilization, scalable multi-node training, and is compatible with HPC workload managers like Slurm.
To ensure reliability and performance, the recommended workflow scales in three stages:
- Write DDP-compatible training code
- Run multi-GPU training on a single node
- Scale to multiple nodes
Training scripts must be designed for distributed execution from the start. For distributed training, ensure your PyTorch scripts are DDP-compatible by implementing distributed initialization for the communication backend, maintaining one process per GPU for independent operation, and utilizing distributed dataset sampling alongside rank-aware logic to ensure unique data processing and conflict-free logging.
For full implementation details, follow the Official PyTorch Distributed Documentation.
This guide focuses on Slurm/HPC setup, multi-node scaling, and monitoring on the Vega supercomputer, assuming your training code already follows PyTorch best practices. Configuration examples (such as module names, network interfaces, and NCCL settings) are specific to Vega’s NVIDIA A100 GPU nodes and InfiniBand interconnect and may require adjustment on other HPC systems.
2. Running Distributed Training on a Single Node
Before multi-node training, verify that DDP works on one node with multiple GPUs.
Testing on a single node allows you to validate the core DDP logic in a controlled environment, ensuring that model bugs, dataset bottlenecks, and distributed configuration errors are resolved before adding the complexity of multi-node networking.
For a standard 4-GPU node, the Slurm configuration should request a single node with all four GPUs allocated to one task. This allows the launcher to manage the individual GPU processes while ensuring the task has enough CPU cores to handle background data loading without stalling the training loop:
#SBATCH --nodes=1
#SBATCH --gres=gpu:4
#SBATCH --ntasks-per-node=1
#SBATCH --cpus-per-task=32
To execute the training, use torchrun to launch the script across all allocated GPUs on the node. It automatically handles the necessary environment variables for DDP:
torchrun --nproc_per_node=4 train.py3. Scaling Training to Multiple Nodes
Once single-node training works reliably, scaling to multiple nodes requires configuring distributed networking, scheduler variables, and NCCL communication.
3.1 Slurm Multi-Node Configuration
To scale across the cluster, you can keep running one launcher per node like in the single-node configuration. This allows torchrun to manage the GPU workers internally while ensuring each node has a dedicated block of CPU cores for data processing:
#SBATCH --nodes=2
#SBATCH --gres=gpu:4
#SBATCH --ntasks-per-node=1
#SBATCH --cpus-per-task=32
3.2 Distributed Environment and NCCL Networking
PyTorch requires a master node to coordinate the cluster. By identifying the master address from the Slurm node list and defining the cluster topology, you ensure all nodes connect to the same distributed process group:
export MASTER_ADDR=$(scontrol show hostnames $SLURM_JOB_NODELIST | head -n 1)
export MASTER_PORT=29500

export GPUS_PER_NODE=4
export NNODES=$SLURM_NNODES
To maximize performance on HPC fabrics, configure NCCL to utilize InfiniBand or high-speed interconnects available on Vega’s GPU nodes. These settings enable RDMA communication and reduce latency, which significantly improves gradient synchronization speed between nodes:
export NCCL_NET=IB
export NCCL_DEBUG=INFO
export NCCL_IB_ENABLE=1
export NCCL_SOCKET_IFNAME=ib0
You can also set NCCL_DEBUG=WARN for production runs to prevent log files from becoming excessively large while still capturing critical errors.
3.3 Launch Multi-Node Training
Finally, use srun with torchrun (via python -m torch.distributed.run) to launch distributed training. While torchrun manages the local GPU processes, srun coordinates the launcher to every node in your allocation. This ensures each GPU receives exactly one process while the rendezvous backend handles the synchronization between nodes:
srun python -u -m torch.distributed.run \
    --nproc_per_node=$GPUS_PER_NODE \
    --nnodes=$SLURM_NNODES \
    --node_rank=$SLURM_NODEID \
    --rdzv_backend=c10d \
    --rdzv_endpoint=$MASTER_ADDR:$MASTER_PORT \
    "$SCRIPT_DIR/$SCRIPT_NAME" "${TORCHRUN_ARGS[@]}"
4. Monitoring Training Performance
Monitoring both GPU and CPU resources is essential to ensure your multi-node training scales efficiently. Low utilization typically signals underlying issues such as slow data loading, communication bottlenecks between nodes, or small batch sizes.
4.1 CPU Monitoring
CPU monitoring helps identify data loading and preprocessing bottlenecks that can limit GPU utilization during distributed training.
On HPC Vega, CPU usage can be interactively monitored using standard Linux tools such as htop or top to track CPU utilization, number of active threads, CPU load distribution across processes, and memory consumption of training processes.
For non-interactive Slurm jobs, CPU usage can be logged using top in batch mode:
top -b -d 5 -u $USER & TOP_PID=$!
This records system statistics every five seconds for later inspection of CPU utilization and memory usage. High CPU idle time during training typically indicates bottlenecks such as insufficient num_workers in the dataloader, slow storage access from a network filesystem, or heavy dataset preprocessing overhead.
4.2 GPU Monitoring
To track GPU performance on NVIDIA GPU nodes, nvidia-smi is the standard tool for verifying hardware utilization, allowing you to capture background metrics at a specified interval to monitor utilization, memory bandwidth, power consumption, and temperature:
nvidia-smi dmon -s pucvmet -d 5 & NSMI_PID=$!
In the example shown in the top diagnostic plot in image 1, GPU utilization is near 100%, with only brief dips visible between epochs, which indicates efficient scaling.
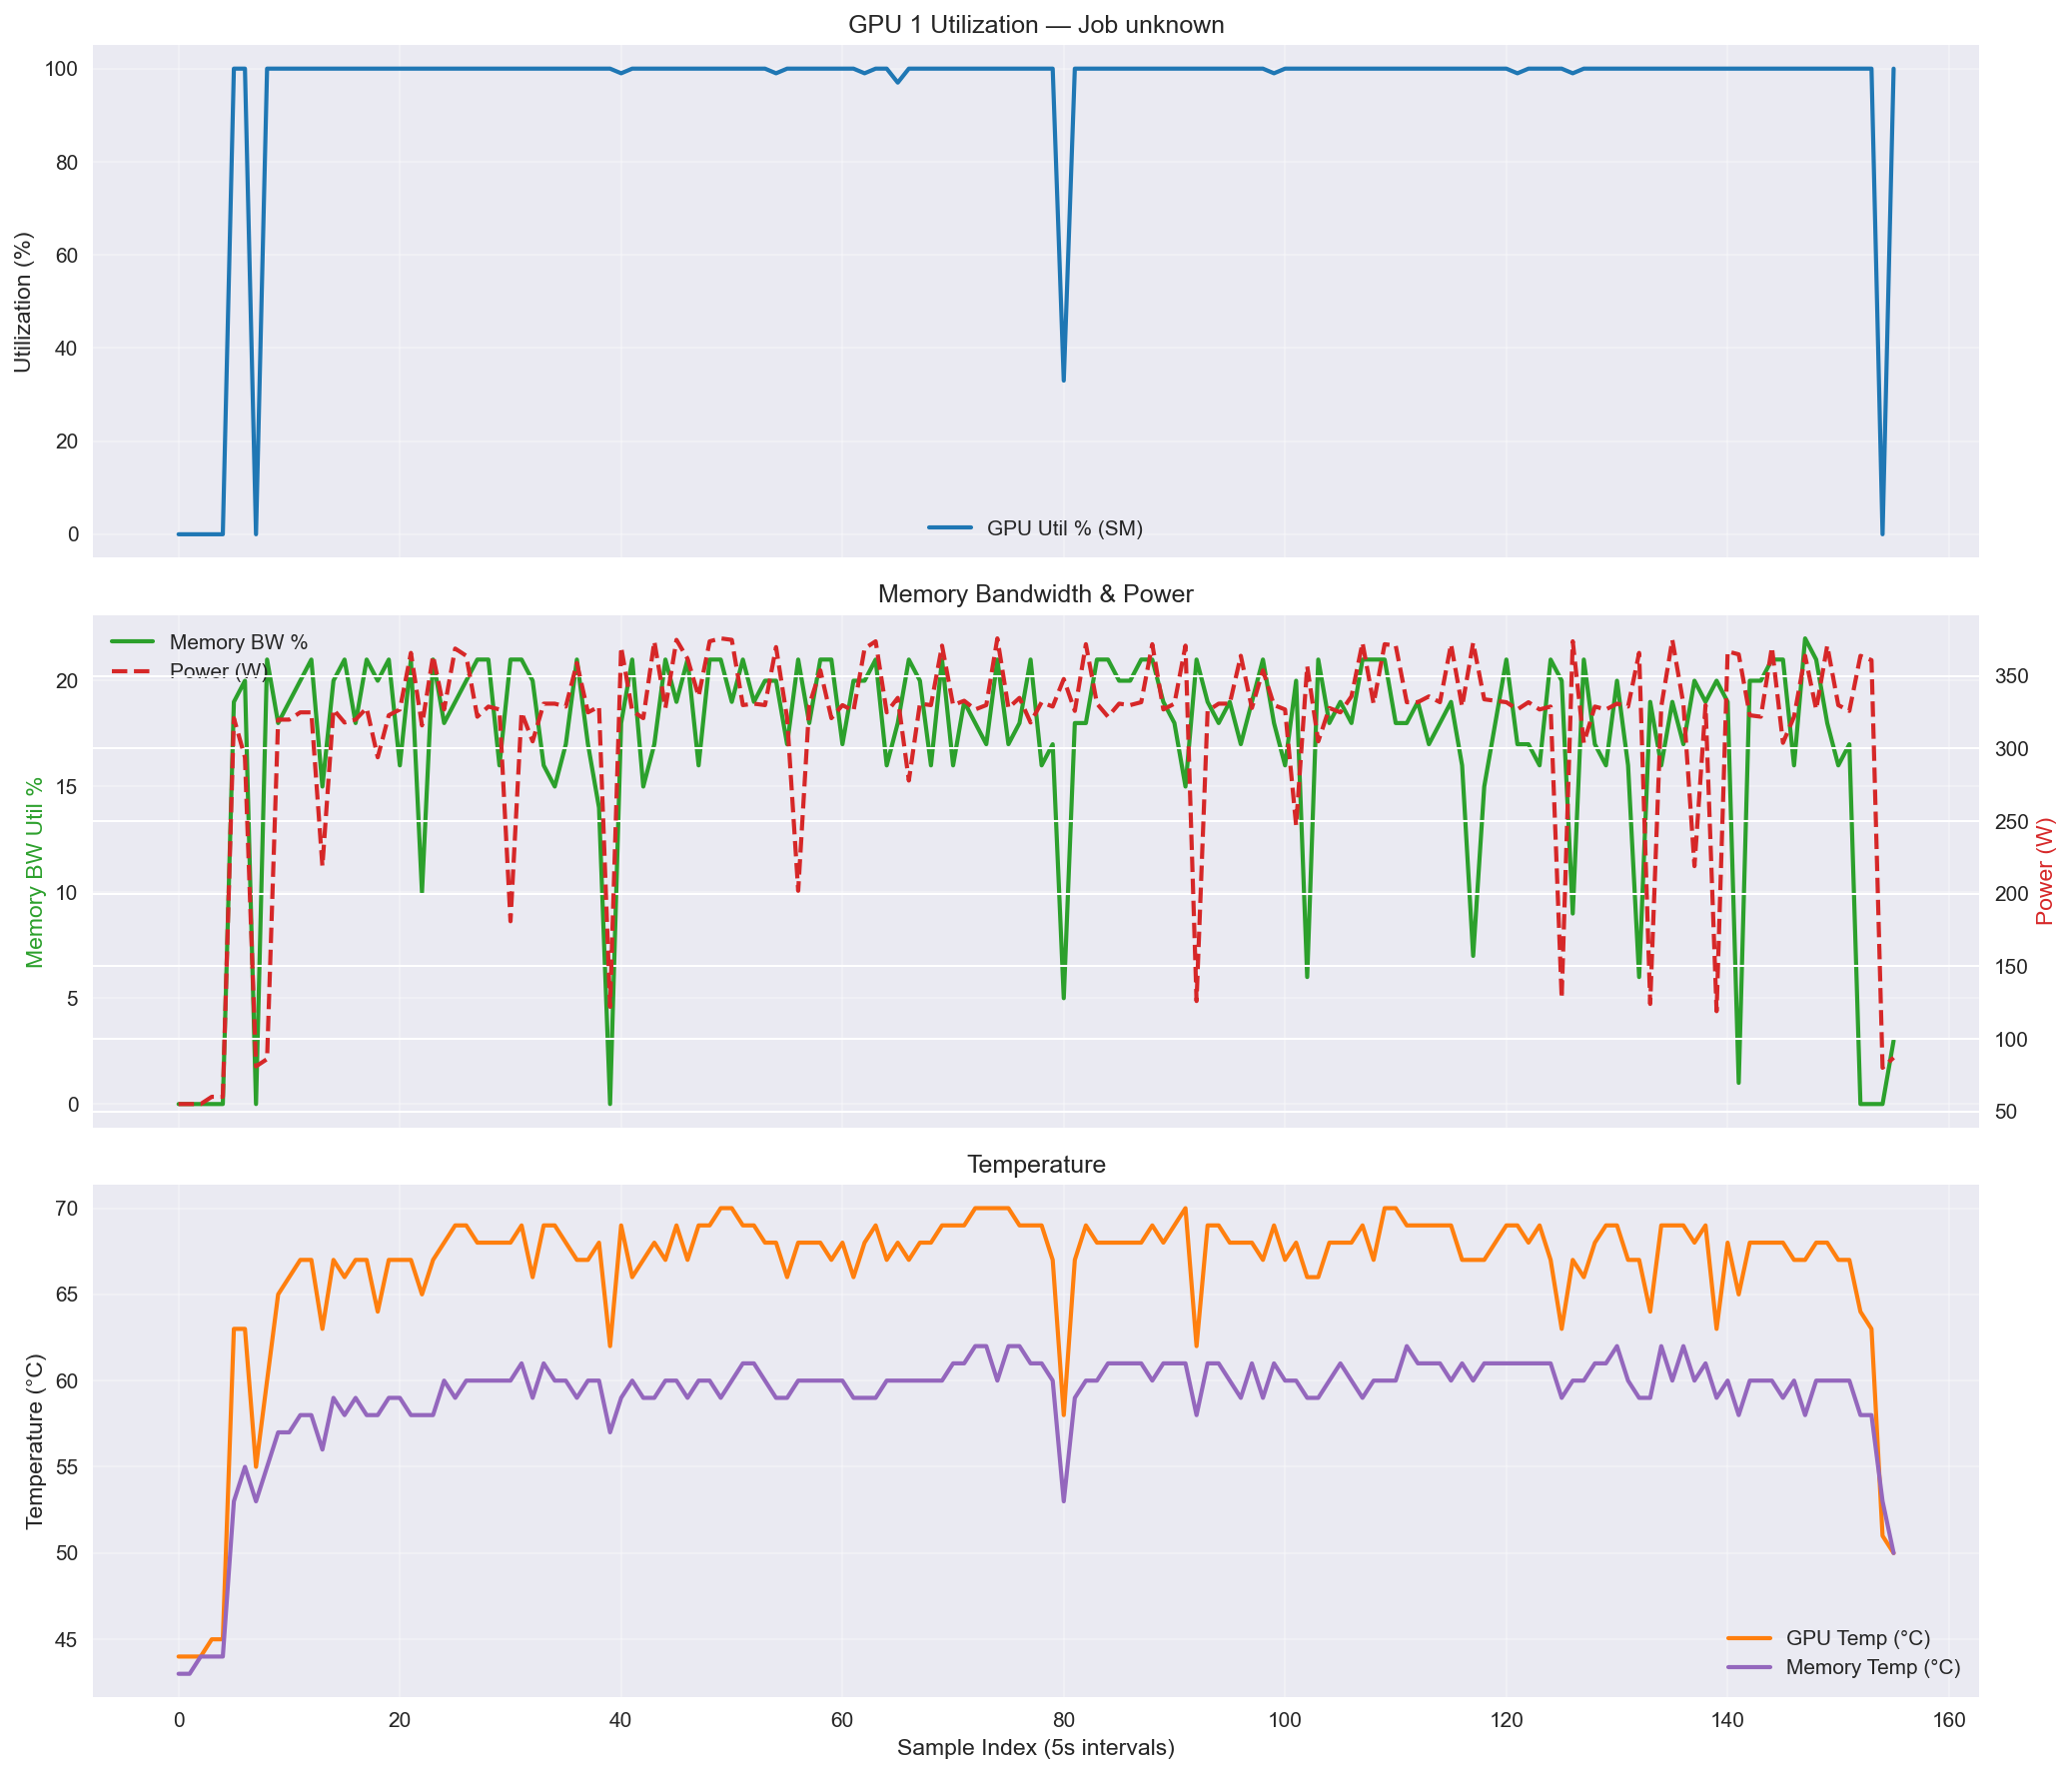
Image 1: nvidia-smi diagnostic plots, showing GPU utilization (top), memory bandwidth and power consumption (middle), and temperature (bottom).
To ensure these background monitoring processes do not continue running after the training job completes or fails, a trap command should be used to kill them on exit:
trap 'kill -9 $NSMI_PID $TOP_PID 2>/dev/null || true' EXIT
4.3 Example Multi-Node Slurm Script
The following script is an example of a fully configured Slurm script for a 2-node training job. It sets up distributed environment variables, launches torchrun, and monitors both GPU and CPU performance:
#!/bin/bash
#SBATCH --job-name=2_node_training
#SBATCH --partition=gpu
#SBATCH --gres=gpu:4
#SBATCH --nodes=2
#SBATCH --ntasks-per-node=1
#SBATCH --cpus-per-task=32
#SBATCH --time=24:00:00
#SBATCH --output=%x_%j.log

SCRIPT_DIR=path/to/your/code
SCRIPT_NAME=training_script_name.py
DATA_DIR=path/to/your/dataset
ENV_DIR=$SCRIPT_DIR/.venv

# Example Environment Setup
module purge
module load Python/3.10
module load CUDA/11.7
module load NCCL
source $ENV_DIR/bin/activate

# Distributed environment variables
export MASTER_ADDR=$(scontrol show hostnames $SLURM_JOB_NODELIST | head -n 1)
export MASTER_PORT=29500

export GPUS_PER_NODE=4
export NNODES=$SLURM_NNODES

export NCCL_NET=IB
export NCCL_IB_ENABLE=1
export NCCL_SOCKET_IFNAME=ib0
export NCCL_DEBUG=INFO
export NCCL_NET_GDR_LEVEL=5

# --- Start GPU Monitoring ---
nvidia-smi dmon -s pucvmet -d 5 & NSMI_PID=$!

# --- Start CPU Monitoring ---
top -b -d 5 -u $USER & TOP_PID=$!

# --- Ensure monitoring processes are killed on exit ---
trap 'kill -9 $NSMI_PID $TOP_PID 2>/dev/null || true' EXIT

# --- Run the Training Script ---
TORCHRUN_ARGS=(
    --data-dir "$DATA_DIR"
    --batch-size 64
    --epochs 3
    --num-workers 32

)

srun python -u -m torch.distributed.run \
    --nproc_per_node=$GPUS_PER_NODE \
    --nnodes=$SLURM_NNODES \
    --node_rank=$SLURM_NODEID \
    --rdzv_backend=c10d \
    --rdzv_endpoint=$MASTER_ADDR:$MASTER_PORT \
    "$SCRIPT_DIR/$SCRIPT_NAME" "${TORCHRUN_ARGS[@]}"
4.4 Slurm Resource Monitoring
In addition to system tools such as top and nvidia-smi, Slurm provides built-in commands to inspect resource usage of running jobs.
The sstat command can be used to monitor CPU and memory usage during execution:
sstat -j $SLURM_JOB_ID --format=JobID,AveCPU,AveRSS,MaxRSS
This command reports:
-
- AveCPU – average CPU time used by the job
-
- AveRSS – average memory usage
-
- MaxRSS – maximum memory usage reached by the job
For completed jobs, Slurm also provides a useful summary using:
seff $SLURM_JOB_ID
This command displays overall job efficiency, including CPU and memory utilization, helping determine whether allocated resources were used effectively.
Additional details about Slurm job configuration, monitoring commands, and reporting tools are available in the official Slurm Workload Manager documentation.
Summary
Efficient PyTorch scaling on the Vega supercomputer requires coordination between distributed training code, job scheduler configuration, high-speed networking, and data loading pipelines. By validating DDP logic on a single node before moving to a multi-node Slurm configuration, you ensure that bottlenecks are identified early through CPU and GPU monitoring. When implemented correctly, these best practices allow PyTorch DistributedDataParallel to scale across dozens or even hundreds of GPUs, significantly reducing training time for large-scale deep learning models while maximizing cluster resource utilization.